Gallery
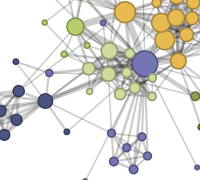 Force-Directed Layout
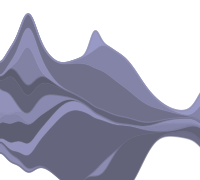 Streamgraphs
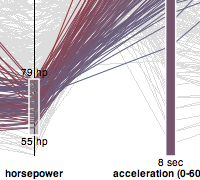 Parallel Coordinates
More examples »
Download
protovis-3.3.1.zip (4.7 MB)
A graphical approach to visualization
Protovis
Protovis composes custom views of data with simple marks such as bars and dots. Unlike low-level graphics libraries that
quickly become tedious for visualization, Protovis defines marks through
dynamic properties that encode data, allowing inheritance, scales and layouts to simplify construction.
Protovis is free and open-source, provided under the BSD License. It uses JavaScript and SVG for web-native visualizations; no plugin required (though you will need a modern web browser)! Although programming experience is helpful, Protovis is mostly declarative and designed to be learned by example.
Protovis is no longer under active development.
The final release of Protovis was v3.3.1 (4.7 MB). The Protovis team is now developing a new visualization library, D3.js, with improved support for animation and interaction. D3 builds on many of the concepts in Protovis; for more details, please read the introduction and browse the examples.
This project was led by Mike Bostock and Jeff Heer of the Stanford Visualization Group, with
significant help from Vadim Ogievetsky. We welcome
your comments and
suggestions.
Updates
June 28, 2011 - Protovis is no longer under active development. We recommend switching to D3.js!
September 17, 2010 - Release 3.3 is available on GitHub.
May 28, 2010 - ZOMG! Release 3.2 is finally available! Enjoy the powerful new layouts and the variety of new examples in the gallery. We’ve also moved from SVN to Gitorious to make it easier for you to participate in development!
October 1, 2009 - Release 3.1 is available, including minor bug fixes. We’ve also spruced up the home page and examples gallery in anticipation of VisWeek 2009.
September 19, 2009 - Release 3.0 is available, including major performance improvments, bug fixes, and handy utilities such as scales and layouts. We’ve also moved all the documentation to the wiki so that we can more easily keep it up-to-date. New tutorials, examples, and documentation are available, and more is on the way.
July 16, 2009 - Release 2.6 is available, including ~2,800 lines of API documentation and numerous bug fixes.
April 9, 2009 - First release on Google Code.
Getting Started
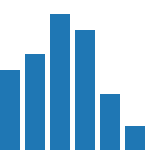
How does Protovis work? Consider this bar chart, which visually encodes an array of numbers with height:
var vis = new pv.Panel()
    .width(150)
    .height(150);

vis.add(pv.Bar)
    .data([1, 1.2, 1.7, 1.5, .7, .3])
    .width(20)
    .height(function(d) d * 80)
    .bottom(0)
    .left(function() this.index * 25);

vis.render();
|
|
This blue bar is rendered once per number, mapping the data to height using a little function (d * 80). Thus, a mark represents a set of graphical elements that share data and visual encodings. Although marks are simple by themselves, you can combine them in interesting ways to make rich, interactive visualizations.
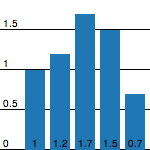
To simplify construction, Protovis supports panels and inheritance. A panel is a container for replicating marks. Inheritance lets you derive new marks from existing ones, sharing some or all of the properties. For example, here we derive labels for a rule and bar:
var vis = new pv.Panel()
    .width(150)
    .height(150);

vis.add(pv.Rule)
    .data(pv.range(0, 2, .5))
    .bottom(function(d) d * 80 + .5)
  .add(pv.Label);

vis.add(pv.Bar)
    .data([1, 1.2, 1.7, 1.5, .7])
    .width(20)
    .height(function(d) d * 80)
    .bottom(0)
    .left(function() this.index * 25 + 25)
  .anchor("bottom").add(pv.Label);

vis.render();
|
|
The rule’s label inherits the data and bottom property, causing it to appear on the rule and render the value (datum) as text. The bar’s label uses the bottom anchor to tweak positioning, so that the label is centered at the bottom of the bar.
Want to learn more? Peruse our examples and documentation.