Dots
The dot mark type represents a symbol that can be stroked (via strokeStyle) and sometimes filled (via fillStyle). Dots are used most frequently for scatterplots, but are also useful for annotating data points in other types of visualization, such as line charts and area charts.
See also: pv.Dot API reference
Examples: Scatterplots, Anderson’s Flowers, Bubble Charts
Placement
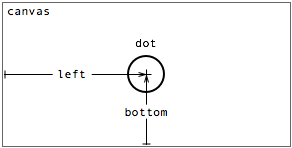
A dot's position and dimensions are specified through some combination of properties:
- top - the distance from the top edge of the parent panel to the dot center.
- left - the distance from the left edge of the parent panel to the dot center.
- bottom - the distance from the bottom edge of the parent panel to the dot center.
- right - the distance from the right edge of the parent panel to the dot center.
- size - the size (proportional to area) of the dot.
Note that the first four properties together over-specify the position of the dot. In practice, only two (orthogonal) properties should be specified. This section looks at some examples.
Using left and bottom
The most common combination of parameters is left and bottom. In the typical bivariate (i.e., x and y) incarnation, each property visually encodes one dimension of the data. For example, a simple scatterplot:
new pv.Panel()
    .width(150)
    .height(150)
  .add(pv.Dot)
    .data([[.1, 1], [.5, 1.2], [.9, 1.7], [.2, 1.5], [.7, 2.2]])
    .left(function(d) d[0] * 150)
    .bottom(function(d) d[1] * 50)
  .root.render();
|
It is also possible to use dots with univariate (one-dimensional) data. In this case, one property is positioned at regular intervals based on the data index, while the other encodes the data. For example, using equispaced left (calculated using the automatic index variable) and variable bottom, in conjunction with rules, produces a popsicle forest:
new pv.Panel()
    .width(150)
    .height(150)
  .add(pv.Dot)
    .data([1, 1.2, 1.7, 1.5, .7, .2])
    .bottom(function(d) d * 80)
    .left(function() this.index * 25 + 10)
  .add(pv.Rule)
    .height(function() this.proto.bottom() - 5)
    .bottom(0)
  .root.render();
|
The size property, which defaults to 20, provides an additional non-stylistic encoding dimension to the scatterplot:
new pv.Panel()
    .width(150)
    .height(150)
  .add(pv.Dot)
    .data([[.1, 1, .4], [.5, 1.2, .3], [.9, 1.7, .1],
           [.4, 1.5, 1], [.3, 1.4, 4], [.7, 2.2, 1]])
    .left(function(d) d[0] * 100)
    .bottom(function(d) d[1] * 50)
    .size(function(d) d[2] * 200)
  .root.render();
|
Occlusion is frequently an issue with large, filled dots. This can be mitigated by drawing the largest dots first—a simple sort of the data. Alpha blending can also be used:
new pv.Panel()
    .width(150)
    .height(150)
  .add(pv.Dot)
    .data([[.1, 1, .4], [.5, 1.2, .3], [.9, 1.7, .1],
           [.4, 1.5, 1], [.3, 1.4, 4], [.7, 2.2, 1]]
        .sort(function(a, b) b[2] - a[2]))
    .left(function(d) d[0] * 100)
    .bottom(function(d) d[1] * 50)
    .size(function(d) d[2] * 200)
    .strokeStyle("white")
    .fillStyle("rgba(30, 120, 180, .4)")
  .root.render();
|
Using top instead of bottom, or right instead of left
By defining the top parameter instead of bottom, the dots are flipped vertically:
new pv.Panel()
    .width(150)
    .height(150)
  .add(pv.Dot)
    .data([1, 1.2, 1.7, 1.5, .7, .2])
    .top(function(d) d * 80)
    .left(function() this.index * 25 + 10)
  .add(pv.Rule)
    .height(function() this.proto.top() - 5)
    .top(0)
  .root.render();
|
Similarly, using right instead of left flips horizontally:
new pv.Panel()
    .width(150)
    .height(150)
  .add(pv.Dot)
    .data([1, 1.2, 1.7, 1.5, .7, .2])
    .right(function(d) d * 80)
    .top(function() this.index * 25 + 10)
  .add(pv.Rule)
    .width(function() this.proto.right() - 5)
    .right(0)
  .root.render();
|
The choice of bottom and left is suitable for the typical case of positive values in the I quadrant of the Cartesian coordinate system.
Style
A dot’s visual style is specified through four optional properties:
- shape - the type of shape (e.g., "circle", "triangle", "square").
- strokeStyle - the stroke color.
- lineWidth - the stroke thickness.
- fillStyle - the fill color.
By default, a strokeStyle color is allocated from the category10 color palette. The default fillStyle is null, and the default lineWidth is 1.5. The default shape is "circle"; other supported shapes include "triangle", "diamond", "cross" and "square". These visual parameters can be specified on a per-instance basis, meaning they too can be used to encode data visually.
Although it is generally advisable to use colors and shapes sparingly, as together they can confound the perception of data patterns, it is possible to use these parameters to make lucky charms:
new pv.Panel()
    .width(150)
    .height(150)
  .add(pv.Dot)
    .data(["circle", "square", "triangle", "cross", "diamond"])
    .left(function() Math.random() * 100 + 25)
    .bottom(function() this.index * 25 + 25)
    .shape(function(d) d)
    .fillStyle(pv.Colors.category10().by(pv.index))
  .root.render();
|