Areas
The area mark type represents the solid area between two polylines that can be filled (via fillStyle) and stroked (via strokeStyle). Unsurprisingly, areas are used most frequently for area charts.
See also: pv.Area API reference
Examples: Area Charts, Stacked Charts, Streamgraphs
Placement
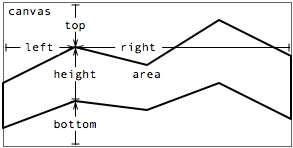
An area’s position and dimensions are specified through some combination of properties:
- top - the distance from the top edge of the parent panel.
- left - the distance from the left edge of the parent panel.
- bottom - the distance from the bottom edge of the parent panel.
- right - the distance from the right edge of the parent panel.
- width - the width of the bar.
- height - the height of the bar.
Either the width or the height property must be specified, but not both. This determines whether the area is horizontally- or vertically-oriented. Unlike most other mark types, with an area, a single graphical element (the polygon) is generated. In effect the placement is specified as a series of discrete vertical or horizontal spans:
Note that these properties together over-specify the placement of the area. In practice, in addition to either the width or the height, only two (orthogonal) properties should be specified. This section looks at some examples.
To produce a standard area chart encoding a single variable with position—i.e., for univariate data—use constant bottom, equispaced left and variable height:
new pv.Panel()
    .width(150)
    .height(150)
  .add(pv.Area)
    .data([1, 1.2, 1.7, 1.5, .7, .5, .2])
    .bottom(0)
    .height(function(d) d * 80)
    .left(function() this.index * 25)
  .root.render();
|
The left property is calculated using the automatic index variable. The index starts at 0 for the first datum, and is subsequently incremented by 1. Watch what happens if we use the area to encode two variables with position:
new pv.Panel()
    .width(150)
    .height(150)
  .add(pv.Area)
    .data([[0, 1], [.5, 1.2], [.9, 1.7], [.5, 1.5], [.4, .7], [.3, .5], [.1, .2]])
    .bottom(function(d) d[0] * 80)
    .height(function(d) (d[1] - d[0]) * 80)
    .left(function() this.index * 25)
  .root.render();
|
Using left and bottom with width
If a vertical area is desired, use width instead of height, and fix the left edge while making the bottom equispaced:
new pv.Panel()
    .width(150)
    .height(150)
  .add(pv.Area)
    .data([1, 1.2, 1.7, 1.5, .7, .5, .2])
    .left(0)
    .width(function(d) d * 80)
    .bottom(function() this.index * 25)
  .root.render();
|
It is possible to specify right instead of left, which will result in a horizontal flip; similarly top instead of bottom results in a vertical flip. For examples of this alternative specification, see the line and bar documentation.
Using segmented
new pv.Panel()
    .width(150)
    .height(150)
  .add(pv.Area)
    .segmented(true)
    .data([1, 1.2, 1.7, 1.5, .7, .5, .2])
    .bottom(0)
    .height(function(d) d * 70)
    .left(function() this.index * 20 + 15)
    .fillStyle(function(d) "hsl(" + (d * 180) + ",50%,50%)")
  .root.render();
|
Description forthcoming.
Using interpolate
new pv.Panel()
    .width(150)
    .height(150)
  .add(pv.Area)
    .data([1, 1.2, 1.7, 1.5, .7, .5, .2])
    .bottom(0)
    .height(function(d) d * 80)
    .left(function() this.index * 20 + 15)
    .interpolate("step-after")
  .root.render();
|
Description forthcoming.
Style
An area’s visual style is specified through three optional properties:- fillStyle - the fill color.
- strokeStyle - the stroke color.
- lineWidth - the stroke thickness.
By default, a fillStyle color is allocated from the category20 color palette for each mark. The default strokeStyle is null, causing the related lineWidth to be ignored. Unless the area is segmented, these properties cannot be specified on a per-instance basis.
Note that strokeStyle strokes the entire perimeter of the area:
new pv.Panel()
    .width(150)
    .height(150)
  .add(pv.Area)
    .data([1, 1.2, 1.7, 1.5, .7, .5, .2])
    .bottom(10)
    .height(function(d) d * 75)
    .left(function() this.index * 20 + 10)
    .strokeStyle("black")
  .root.render();
|
See the color documentation for more examples of acceptable values for stroke and fill styles.