Bars
The bar mark type represents an axis-aligned rectangle that can be filled (via fillStyle) and stroked (via strokeStyle). Bars are used for many popular visualization types, including bar charts, grouped bar charts, stacked bar charts and histograms.
See also: pv.Bar API reference
Examples: Bar & Column Charts, Grouped Charts, Histograms
Placement
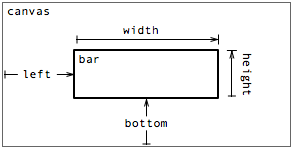
A bar’s position and dimensions are specified through some combination of properties:
- top - the distance from the top edge of the parent panel.
- left - the distance from the left edge of the parent panel.
- bottom - the distance from the bottom edge of the parent panel.
- right - the distance from the right edge of the parent panel.
- width - the width of the bar.
- height - the height of the bar.
Note that these properties together over-specify the placement of the bar. In practice, only four (orthogonal) properties should be specified. This section looks at some examples.
Using left, bottom, width and height
To produce a standard bar chart encoding a single variable with position—i.e., for univariate data—use constant bottom, constant width, equispaced left and variable height:
new pv.Panel()
    .width(150)
    .height(150)
  .add(pv.Bar)
    .data([1, 1.2, 1.7, 1.5, .7])
    .bottom(0)
    .width(20)
    .height(function(d) d * 80)
    .left(function() this.index * 25)
  .root.render();
|
The left property is calculated using the automatic index variable. The index starts at 0 for the first datum, and is subsequently incremented by 1.
For multivariate data, simply specify additional properties as functions rather than constants. For example, a Gantt chart can be produced using variable left and width, with equispaced bottom and constant height:
new pv.Panel()
    .width(150)
    .height(150)
  .add(pv.Bar)
    .data([[0, 1], [.5, 1.2], [.9, 1.7], [.2, 1.5], [.7, 2.2]])
    .height(20)
    .bottom(function() this.index * 25)
    .width(function(d) (d[1] - d[0]) * 50)
    .left(function(d) d[0] * 50)
  .root.render();
|
Thus, with only four properties, a number of different visualizations can be expressed. More possibilities are available by using the additional top and right properties, as discussed next.
Using top instead of bottom, or right and left
By defining the top instead of bottom, the bars are flipped vertically:
new pv.Panel()
    .width(150)
    .height(150)
  .add(pv.Bar)
    .data([1, 1.2, 1.7, 1.5, .7])
    .top(0)
    .width(20)
    .height(function(d) d * 80)
    .left(function() this.index * 25)
  .root.render();
|
Similarly, using right instead of left produces right-to-left ordering:
new pv.Panel()
    .width(150)
    .height(150)
  .add(pv.Bar)
    .data([1, 1.2, 1.7, 1.5, .7])
    .bottom(0)
    .width(20)
    .height(function(d) d * 80)
    .right(function() this.index * 25)
  .root.render();
|
You can even vary which properties are defined on a per-element basis, by using a function that returns null if the property is undefined.
Using left with right, or top with bottom
Sometimes it is desirable to specify the left and right properties concurrently, instead of specifying one in conjunction with width. This is valid—for example to make insets—but keep in mind that the left property is relative to the left edge of the parent panel, while the right property is relative to the right edge of the parent panel. This results in a bar width that is proportional to the panel width, which may not be desired. A similar situation occurs with bar height when top and bottom are used together.
It may be better to pick one property for position (e.g., left) and another for length (e.g., width) and then perform subtraction in the length property if necessary, as is done in the Gantt chart example above.
Style
A bar’s visual style is specified through three optional properties:
- fillStyle - the fill color.
- strokeStyle - the stroke color.
- lineWidth - the stroke thickness.
By default, a fillStyle color is allocated from the category20 color palette for each mark. The default strokeStyle is null, causing the related lineWidth to be ignored. These visual properties can be specified on a per-instance basis, meaning they too can be used to encode data visually. For example, to make a rainbow:
new pv.Panel()
    .width(150)
    .height(150)
  .add(pv.Bar)
    .data(["red", "orange", "yellow", "green", "blue", "purple"])
    .left(0)
    .right(0)
    .height(25)
    .top(function() this.index * 25)
    .fillStyle(function(d) d)
  .root.render();
|
Or, to highlight all data greater than 1:
new pv.Panel()
    .width(150)
    .height(150)
  .add(pv.Bar)
    .data([1, 1.2, 1.7, 1.5, .7])
    .bottom(2)
    .width(20)
    .height(function(d) d * 80)
    .left(function() this.index * 25 + 2)
    .strokeStyle(function(d) (d > 1) ? "red" : "black")
  .root.render();
|
See the color documentation for more examples of acceptable values for stroke and fill styles.