Conventional
While Protovis is designed for custom visualization, it is still easy to create many standard chart types. These simpler examples serve as an introduction to the language, demonstrating key abstractions such as quantitative and ordinal scales, while hinting at more advanced features, including stack layout.
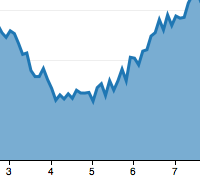 Area Charts
 Bar & Column Charts
 Scatterplots
 Pie & Donut Charts
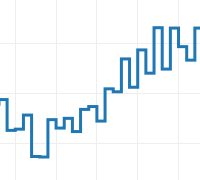 Line & Step Charts
 Stacked Charts
 Grouped Charts
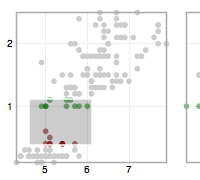
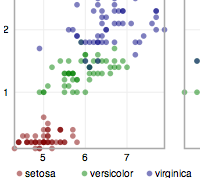 Anderson’s Flowers
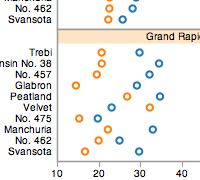 Becker’s Barley
 Bertin’s Hotel
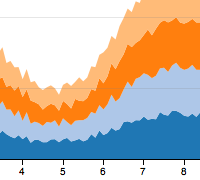
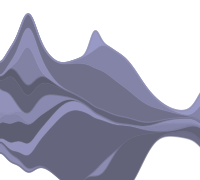 Streamgraphs
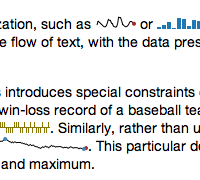 Sparklines
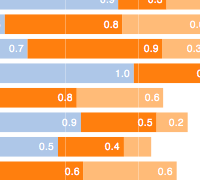
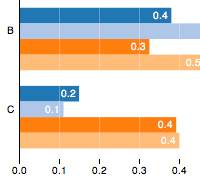
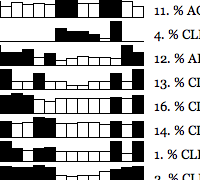
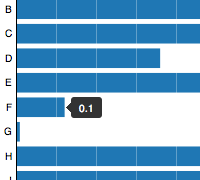
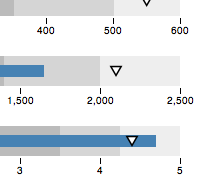 Bullet Charts
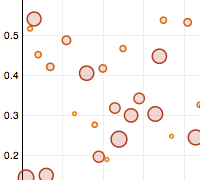
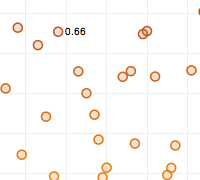
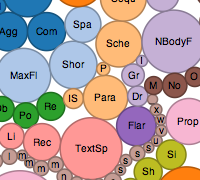 Bubble Charts
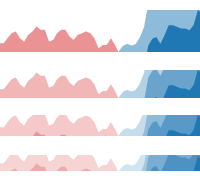 Sizing the Horizon
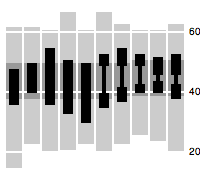
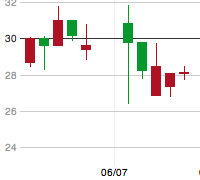 Candlestick Charts
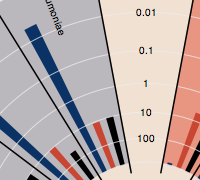 Burtin’s Antibiotics
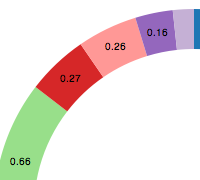
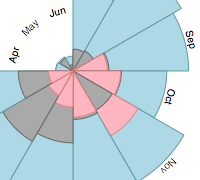 Nightingale’s Rose
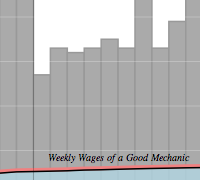 Playfair’s Wheat
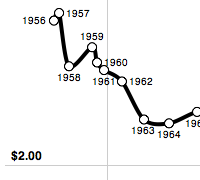 Gas & Driving
 Seattle Weather
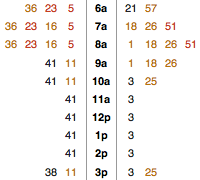
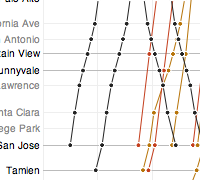 Marey’s Trains
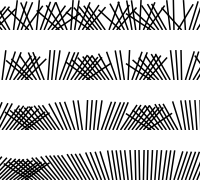
 Stemplots
 Merge Sort
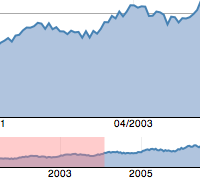
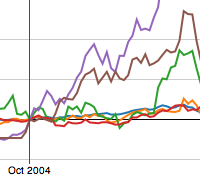 Index Charts
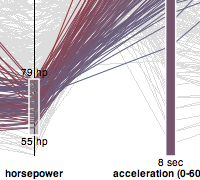 Parallel Coordinates
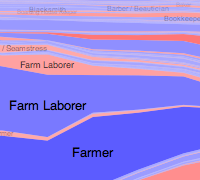 Job Voyager
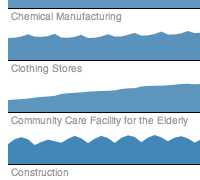 Minnesota Employment
 Focus + Context
 Brush + Link
 Tooltips
 Pointing
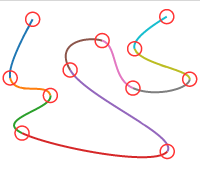 Spline Editor
 Bubbles
 Eyes
Eyes
 Dendrograms
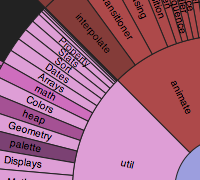 Sunbursts
 Icicles
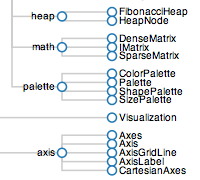
 Indented Trees
 Circle Packing
 Node-Link Trees
 Treemaps
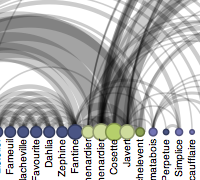 Arc Diagrams
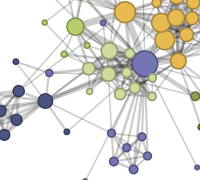 Force-Directed Layouts
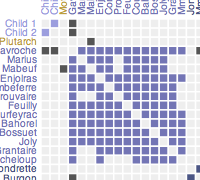 Matrix Diagrams
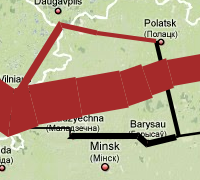 Minard’s Napoleon
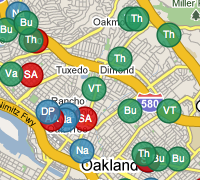 Oakland Crimespotting
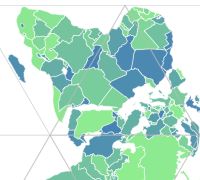
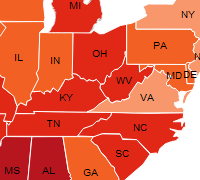 Choropleth Maps
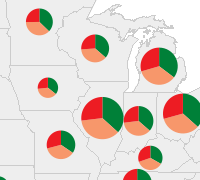 Symbol Maps
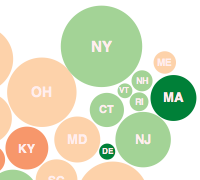 Dorling Cartograms
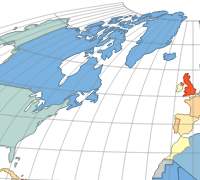 Map Projections
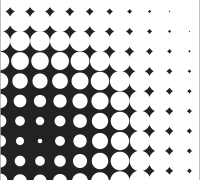
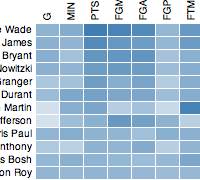
 Heatmaps
 Dymaxion Maps
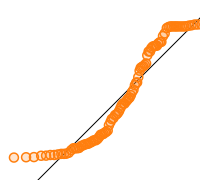 Q-Q Plots
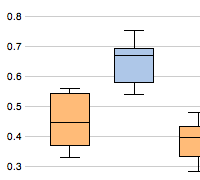 Box-and-Whisker Plots
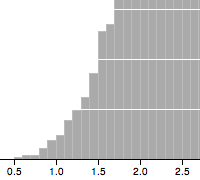 Histograms
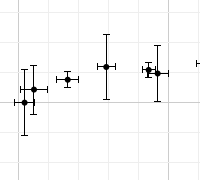 Error Bars
 Mean & Deviation
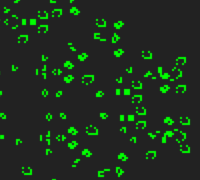 Conway’s Game of Life
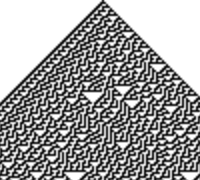 Automaton Explorer
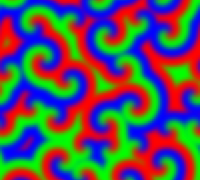 Belousov–Zhabotinsky
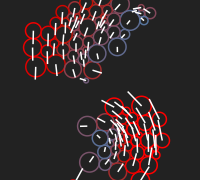 N-Body Problem
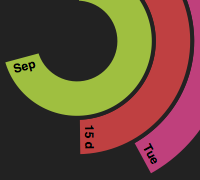 PolarClock
 Rainbow Worm