Lines
The line mark type represents a series of connected line segments, sometimes called a polyline, that can be stroked (via strokeStyle). Lines are used most frequently for line charts, but are also useful in conjunction with other marks in other types of visualization, such as area charts.
See also: pv.Line API reference
Examples: Line & Step Charts, Sparklines, Parallel Coordinates
Placement
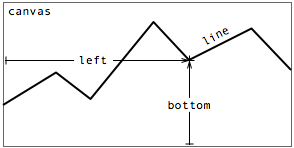
A line’s placement is specified through some combination of attributes:
- top - the distance from the top edge of the parent panel to the line center.
- left - the distance from the left edge of the parent panel to the line center.
- bottom - the distance from the bottom edge of the parent panel to the line center.
- right - the distance from the right edge of the parent panel to the line center.
Note that the properties together over-specify the position of the line. In practice, only two (orthogonal) properties should be specified; the choice of which two is provided for convenience. This section looks at some examples.
Using left and bottom
In the simplest univariate incarnation, one property is positioned at regular intervals based on the data index, and the other visually encodes the data. For example, using equispaced left (calculated using the automatic index variable) and variable bottom produces a standard line chart:
new pv.Panel()
    .width(150)
    .height(150)
  .add(pv.Line)
    .data([1, 1.2, 1.7, 1.5, .7, .5, .2])
    .bottom(function(d) d * 80)
    .left(function() this.index * 20 + 15)
  .root.render();
|
In some cases, it may be desired to annotate the data points generating the line with dots. This can be done with a simple call to add(pv.Dot), since lines and dots are placed using the same parameters:
new pv.Panel()
    .width(150)
    .height(150)
  .add(pv.Line)
    .data([1, 1.2, 1.7, 1.5, .7, .5, .2])
    .bottom(function(d) d * 80)
    .left(function() this.index * 20 + 15)
  .add(pv.Dot)
  .root.render();
|
The left property does not need to be equispaced, and thus can be used to specify alternative visualization types, like radar plots. For example, an Archimedean spiral:
new pv.Panel()
    .width(150)
    .height(150)
  .add(pv.Line)
    .data(pv.range(68))
    .bottom(function(i) 75 + i * Math.sin(6 * Math.PI * i / 100))
    .left(function(i) 75 + i * Math.cos(6 * Math.PI * i / 100))
  .add(pv.Dot)
  .root.render();
|
Using top instead of bottom, or right instead of left
By defining the top property instead of bottom, the line is flipped vertically:
new pv.Panel()
    .width(150)
    .height(150)
  .add(pv.Line)
    .data([1, 1.2, 1.7, 1.5, .7, .5, .2])
    .top(function(d) d * 80)
    .left(function() this.index * 20 + 15)
  .root.render();
|
Similarly, using right instead of left flips horizontally:
new pv.Panel()
    .width(150)
    .height(150)
  .add(pv.Line)
    .data([1, 1.2, 1.7, 1.5, .7, .5, .2])
    .top(function(d) d * 80)
    .right(function() this.index * 20 + 15)
  .root.render();
|
The choice of bottom and left is suitable for the typical case of positive values in the I quadrant of the Cartesian coordinate system.
Using segmented
new pv.Panel()
    .width(150)
    .height(150)
  .add(pv.Line)
    .segmented(true)
    .data([1, 1.2, 1.7, 1.5, .7, .5, .2])
    .bottom(function(d) d * 70)
    .left(function() this.index * 20 + 15)
    .strokeStyle(function(d) "hsl(" + (d * 180) + ",50%,50%)")
    .lineWidth(function(d) d * 15)
  .root.render();
|
Description forthcoming.
Using interpolate
new pv.Panel()
    .width(150)
    .height(150)
  .add(pv.Line)
    .data([1, 1.2, 1.7, 1.5, .7, .5, .2])
    .bottom(function(d) d * 80)
    .left(function() this.index * 20 + 15)
    .interpolate("step-after")
  .root.render();
|
Description forthcoming.
Style
A line’s visual style is specified through two optional properties:
- strokeStyle - the stroke color.
- lineWidth - the stroke thickness.
By default, a strokeStyle color is allocated from the category10 color palette. The default fillStyle is null, and the default lineWidth is 1.5. Unlike some other marks, these properties cannot be specified on a per-instance basis. TODO: that is, unless the segmented property is set to true.
Here is an example of some thick lines in various colors:
new pv.Panel()
    .width(150)
    .height(150)
  .add(pv.Panel)
    .data(pv.range(3))
    .bottom(function() this.index * 50 + 5)
  .add(pv.Line)
    .data(pv.range(14))
    .left(function() this.index * 10 + 10)
    .bottom(function() Math.random() * 40)
    .lineWidth(5)
  .root.render();
|
Using fillStyle
new pv.Panel()
    .width(150)
    .height(150)
  .add(pv.Line)
    .data(pv.range(0, 2 * Math.PI, .01))
    .left(function(d) Math.cos(d) * (Math.cos(d * 5) + 5) * 10 + 75)
    .top(function(d) Math.sin(d) * (Math.cos(d * 5) + 5) * 10 + 75)
    .fillStyle("orange")
  .root.render();
|
Description forthcoming.
See the color documentation for more examples of acceptable values for stroke and fill styles.